
Want to combine more than one Salesforce Wave datasets into the same chart widget in SAQL? Well, you’ve come to the right place. This is something that practically no one is discussing and it’s easy to feel like you’re on your own!
Additionally, In my SAQL experience I’ve determined that it’s all about the bindings! Salesforce has a good guide but it could contain additional information. It’s also easy to get confused between the classic dashboard/bindings and the new & improved bindings.
Today we are going to cover two primary objectives: (1) Combine at least two datasets into the same stream/chart widget. (2) Create a static step to present a variety of fixed options that will be fed into the query from #1 as a parameter that will control the results and make the dashboard interactive!
The Data
We are going to use data downloaded from the US Government – thrilling!
Dataset 1: US Population by State from 2010 Census

Dataset 2: Top 10 Causes of Death by State (Years 1999-2013)

With Dataset #2 we can do some really cool things like a donut to show the # of deaths by cause for a single year:

We can also use a timeline chart to see the # of deaths by cause over time:

The reason we want Dataset #1 is that some states have more people living in them than others (shocking, I know). We want to take the # of deaths by state in 2010 and divide by the population of each state in 2010 to calculate deaths per capita.
Combining Multiple Datasets Into Single Widget
The primary rule with joining more than one dataset into a single SAQL query/widget/chart is that you have to use a dashboard. You cannot do this within a single Lens. A Lens is explicitly tied to a single dataset.
We also have to add a place-holder step/chart to the dashboard for both of the datasets we want to access before we can combine both datasets into a single step.
For example, if I just create a new dashboard, drag on a chart widget, click on it and then create a new step and navigate to the SAQL and create the query I want to use, which is this by the way:
q = load "X2010_Census_Population";
q = group q by 'State';
q = foreach q generate 'State' as 'State', sum('X2010_Census_Population') as 'sum_X2010_Census_Population';
q = order q by 'State' asc;
q = limit q 2000;
a = load "Deaths_for_top_10_causes_by_State";
a = filter a by date('YEAR_Year', 'YEAR_Month', 'YEAR_Day') in [dateRange([2010, 1, 1], [2010, 1, 1])];
a = filter a by 'CAUSE_NAME' != "All Causes";
a = group a by 'STATE';
a = foreach a generate 'STATE' as 'State', sum('DEATHS') as 'sum_DEATHS';
a = order a by 'State' asc;
a = limit a 2000;
x = union q, a;
x = group x by 'State';
x = foreach x generate 'State' as 'State', sum('sum_DEATHS') / sum('sum_X2010_Census_Population') as 'Deaths per Capita';
x = filter x by 'State' != "United States";
x = order x by 'Deaths per Capita' desc;
x = limit x 2000;
I get the following error:
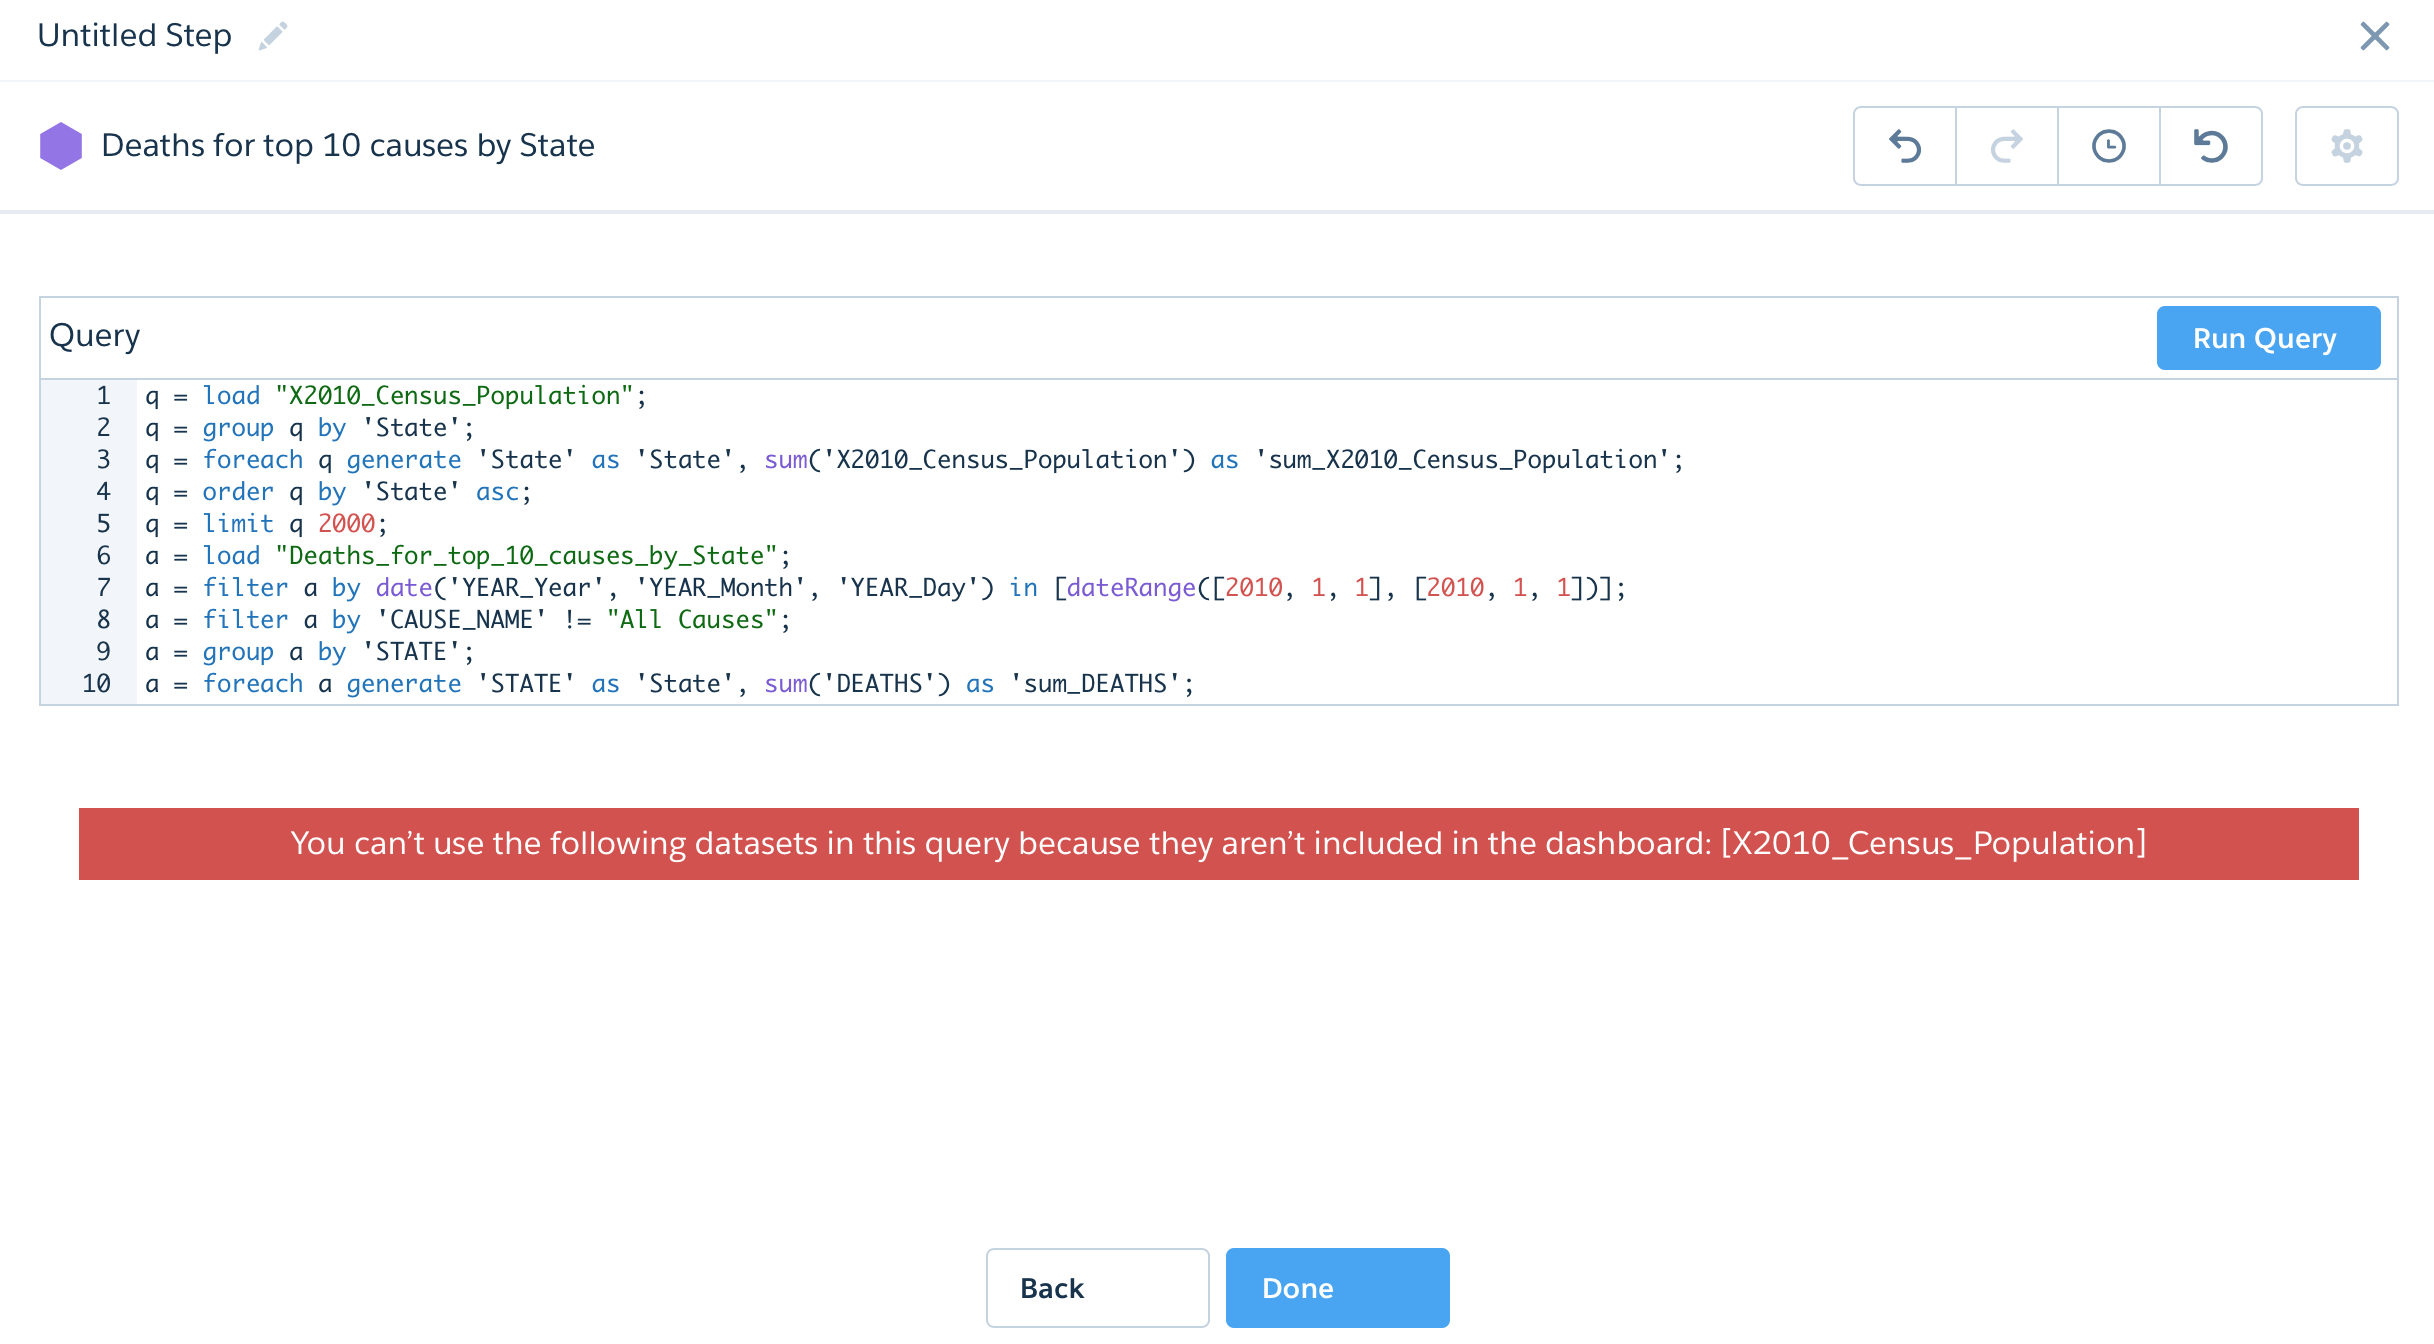
First, some notes on the code above. We are loading “q” which is our 2010 Population by State Dataset (dataset #1 above) and simply grouping by state and providing the total population by state. Then we are loading “a” which is our dataset that contains the # of deaths by state by year for the top 10 leading causes. We are making sure we filter down to just 2010 and filtering out a cause of “All Causes” as these are already included in each granular cause. Then we are just getting the total # of deaths by state. We UNION these together (not really much different than a UNION in SQL) as “x” and run the division to get our ‘Deaths per Capita.’ We have to filter out a state that is listed in both datasets as “United States” as again, just like the “All Causes” scenario, these totals are already included within each individual state.
Here’s how you can use the same code (as above) but not get this error: “You can’t use the following datasets in this query because they aren’t included in the dashboard:”
Step 1: Drag a chart widget onto the dashboard, then click into the middle of the widget where it says “Chart.”
Step 2: Select one of the datasets you want to access in your query.
Step 3: Wave ahem, Einstein Analytics will have a default chart for Count of Rows. You don’t need to change anything here – just click “Done.”
Step 4: Now click on the “Create Step” button in the right column of the Dashboard builder. If it isn’t displaying, ensure you are in “Edit” mode (a Pencil Icon will be displaying in the buttons at the top right if you are not in Edit mode, click this button). If you are in edit mode and you do not see “Create Step” then click somewhere on the background of the dashboard.
Step 5: Now in this step select the other dataset that you need, the one you didn’t select in Step 2.
Step 6: Here is where you can switch to the SAQL mode and write your query using data from both datasets and then join them together either using UNION or COGROUP.

Click “Run Query” to make sure it’s working how you need it to and then click “Done” to finish creating the step.
Now you can use this step for your chart widgets (Drag and drop the step you just created) and delete the first chart widget and step you had to create in steps 1-3. The fact that we have to go through steps 1-3 only to just get rid of them is unexplainable just for fun!
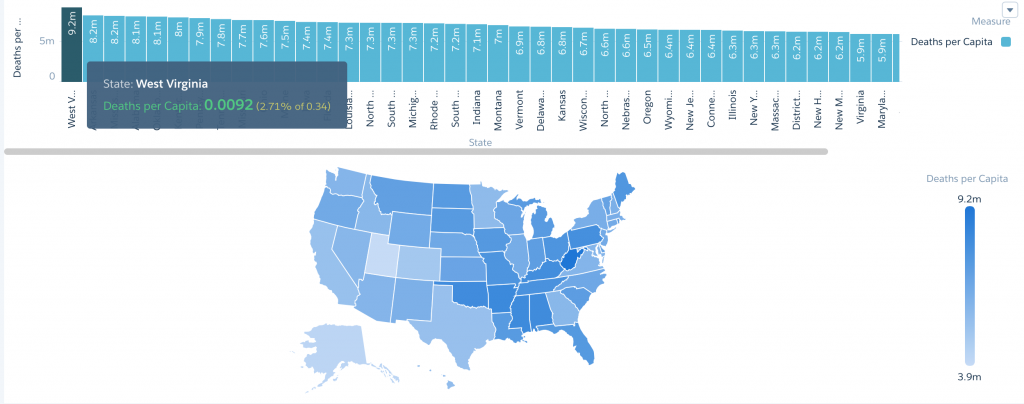
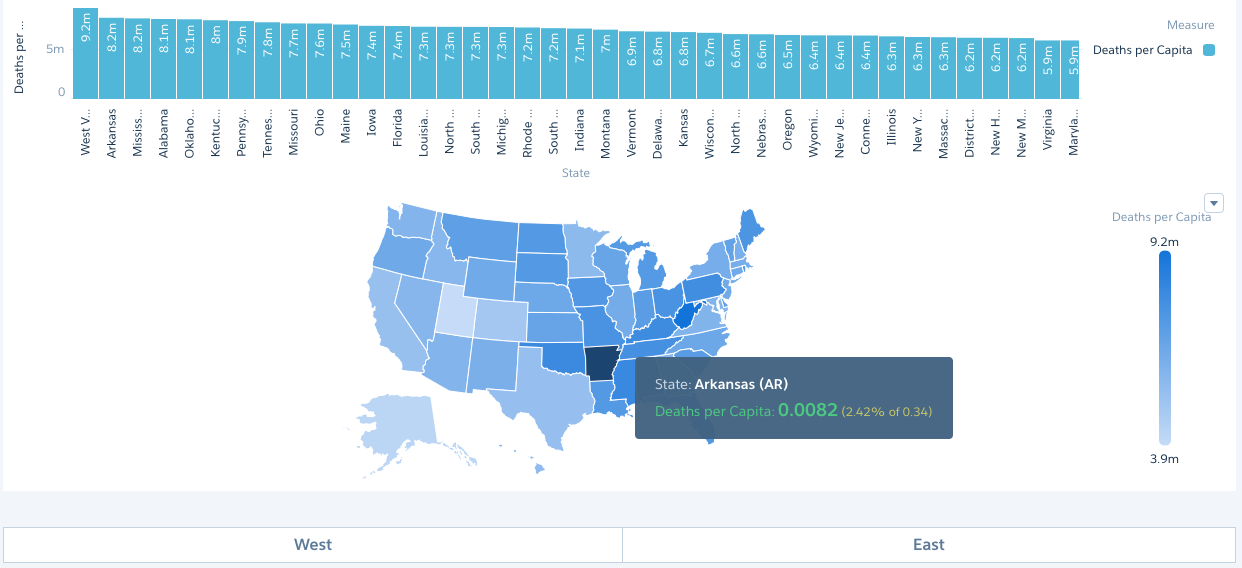
I went ahead and added a US Map widget in addition to the column widget. The state with the highest deaths per capita (from the top 10 causes of death) in 2010 was….drum roll please….West Virginia!
Now we have a step that is accessing data from both datasets and providing the visualization needed. Now, how do we add some interactivity?
Bindings for Interactivity
We are going to create a static step to present options to our dashboard user and a pillbox/toggle for the user to click on to input their selection. Finally we are going to take the result of that input and update our main query step (previously created above) to change the widget based on this input.
We can make a static binding for anything we want. Red/Blue, Avg/Total, East/West. We are simply defining the text that will present to our users and the parameter value we are going to include in our query.
Let’s start with East/West.
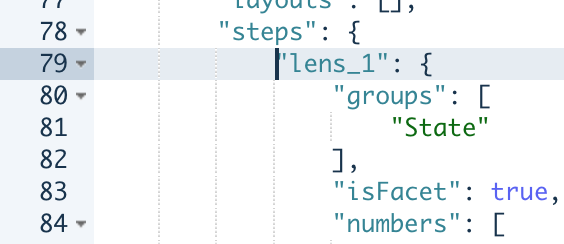
The easiest way to create a static step is to CMD+E / CTRL+E into the JSON and locate where all the Steps are defined. This image displays where the steps begin and the first step:
Place your cursor before the first step and create some line breaks. Then we will use the following code to create our static step.
 "toggle_states": {
   "datasets": [],
   "dimensions": [],
   "groups": [],
   "isFacet": false,
   "isGlobal": false,
   "numbers": [],
   "selectMode": "single",
   "strings": [],
   "type": "staticflex",
   "useGlobal": false,
   "values": [
             {
         "display": "West",
         "value": [
         "West"
             ],
         "Region": "West"
             },
             {
         "display": "East",
         "value": [
             "East"
             ],
         "Region": "East"
              }
         ]
 },
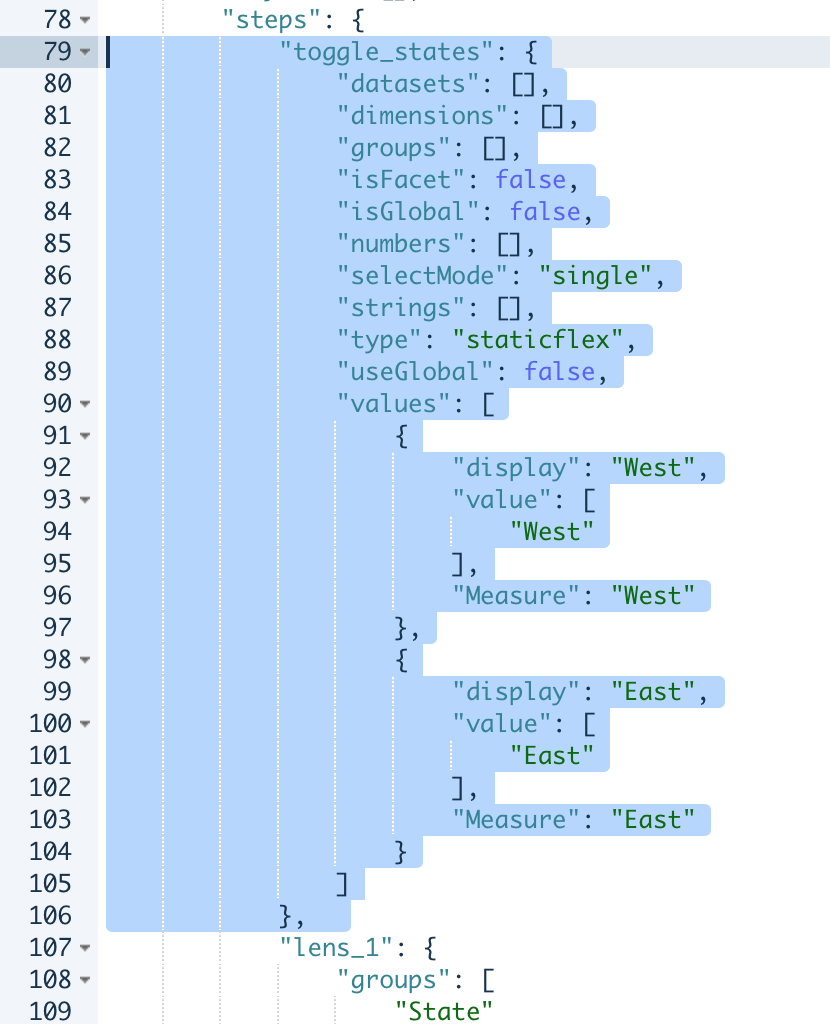
The name of the static step is defined first, you could set this as anything you want. Then we are just adding two values “West” and “East” and labeling them “Region” – this again could be anything you want to label it! We also have ‘value’ and ‘display’ defined to show how you can add multiple properties. ‘Value’ is the text that will display in our toggle pillbox to the end user.
Note the ‘selectMode’ is “Single.” This is important as it defines whether we can select more than one at a time, whether one has to always be selected, etc. For now we are going to use “Single” which means that one of these options is not required to be selected, but we can’t select more than one at a time.
After this code is entered you can click the “Done” button. Now drag this step “toggle_states” onto the dashboard. You will instantly see your two options available to you. You can even run the dashboard (click the eye icon) and toggle between the two options. Yes, they don’t do anything to your data yet…but they exist!
Now we are going to edit our original query from before to include input from this toggle step.
Use CTRL+E or CMD+E to get back into the JSON and locate your original step with the query for the deaths per capita. Here are the groups, numbers, query, and strings for mine after I’ve updated it. Essentially I’ve used a case statement to group the states into West & East. It can even detect when the toggle button is not used and return ‘All.’ I’ve then added a filter that uses the input from the toggle step to filter down to only West or East states.
 "groups": [
 "State"
 ],
 "isFacet": true,
 "numbers": [
 "Deaths per Capita"
 ],
 "query": "q = load \"X2010_Census_Population\";\r\nq = group q by 'State';\r\nq = foreach q generate 'State' as 'State', sum('X2010_Census_Population') as 'sum_X2010_Census_Population';\r\nq = order q by 'State' asc;\r\nq = limit q 2000;\r\n\r\na = load \"Deaths_for_top_10_causes_by_State\";\r\na = filter a by date('YEAR_Year', 'YEAR_Month', 'YEAR_Day') in [dateRange([2010, 1, 1], [2010, 1, 1])];\r\na = filter a by 'CAUSE_NAME' != \"All Causes\";\r\na = group a by 'STATE';\r\na = foreach a generate 'STATE' as 'State', sum('DEATHS') as 'sum_DEATHS';\r\na = order a by 'State' asc;\r\na = limit a 2000;\r\n\r\nx = union q, a;\r\nx = group x by 'State';\r\nx = foreach x generate 'State' as 'State', case when \"{{column(toggle_states.selection,[\"Region\"]).asObject()}}\" == \"\" then \"All\" when 'State' in [\"Colorado\",\"California\",\"Utah\",\"Oregon\",\"Washington\",\"Idaho\",\"Nevada\",\"New Mexico\",\"Utah\",\"Wyoming\",\"Montana\",\"Texas\",\"Oklahoma\",\"Alaska\",\"Hawaii\",\"Kansas\",\"Nebraska\",\"South Dakota\",\"North Dakota\",\"Arizona\"] then \"West\" else \"East\" end as 'Type', sum('sum_DEATHS') / sum('sum_X2010_Census_Population') as 'Deaths per Capita';\r\nx = filter x by 'Type' == \"{{column(toggle_states.selection,[\"Region\"]).asObject()}}\" || 'Type' == \"All\";\nx = filter x by 'State' != \"United States\";\nx = order x by 'Deaths per Capita' desc;\nx = limit x 2000;",
 "selectMode": "single",
 "strings": [
 "State"
 ],
 "type": "saql",
Now I can toggle between all:
West:

or East:

There are a lot of cool things you can do with selection bindings to give the user interactivity and control. In this case we are using the parameter as a filter, but you can use it to change the actual metric. For example, we could toggle between the calculation of ‘Deaths per Capita’ and ‘Sum of Deaths’. I’ve even used 3 or 4 separate toggle steps with at least 2 to 3 options each for a single chart widget. You can combine them to build a full featured interactive dashboard that allows for quick and valuable business insights!
There is so much more you can do with bindings, but because this post was primarily about how to combine multiple datasets in SAQL this was just a small taste. Stay tuned for more! Have you had a need to combine multiple datasets? Has this post been helpful? What other questions do you have? I would love to hear in the comments or on twitter @SFDC_r

Sunny Kumar
Thanks for this beautiful explanation and I am able to do my Variance from two different datasets 🙂
SFDCr
I am so glad it has helped you – take care!
Sergey
Sure,
q = load “Dataset_1”;
q = filter q by ‘Franchise_AC__c’ in [“VC”, “Vision Care”];
q = group q by ‘Account_type’;
q = foreach q generate q.’Account_type’ as ‘Account_type’, unique(‘Account.Name’) as ‘A’;
q = order q by (‘Account_type’ asc);
q = limit q 2000;
s = load “Dataset_2″;
s = group s by ‘Account_type’;
s = foreach s generate ‘Account_type’ as ‘Account_type’, unique(‘Account_Name’) as ‘unique_Account_Name’;
s = order s by ‘Account_type’ asc;
s = limit s 2000;
x = union q, s;
x = group x by ‘Account_type’;
x = foreach x generate ‘Account_type’ as ‘Account_type’, number_to_string(unique(‘unique_Account_Name’) / unique(‘A’),”#.00%”) as ‘Coverage’;
x = order x by ‘Coverage’ desc;
x = limit x 2000;
Sergey
Hello SFDCr,
Your post is amazing, Thank you.
I tried repeat it, but i have a problem. I used “unique” function instead “sum” to aggregate my data. in result i’ve got ” – ”
Can you help with it?
SFDCr
Hi Sergey! Thanks for the kind comment. Can you post your code?
Harinder
Hello SFDCr,
Its not working
I am still getting error when using other dataset in SAQL query
SFDCr
Hi Harinder – Can you share any other details? Which error are you getting? Are you making sure to add to the dashboard a widget including the other dataset? Try adding both datasets from dummy widgets first and then trying a new step with both datasets.
Peter Lyons
Great post! I strongly prefer union over cogroup. Who are you?
SFDCr
Hey thanks! My name’s TJ and I’m in the EA Salesforce Group. I’ve been loving the new Analytics Cloud features!
Sunny Kumar
Super and its really awesome and help me out to pull order Vs target variance
SFDCr
Awesome – I am so glad it has helped you!